
WAVS Dashboard
The WAVS Dashboard provides a dashboard interface for running and managing WAVS nodes. Operating a node or verifiable service typically requires watching logs, managing CLI commands, and manually coordinating execution across triggers, components, and submissions. The WAVS Dashboard consolidates this into a unified interface, improving visibility and reducing operational overhead.
Service Management
Services can be created and managed through a guided interface that walks through contract selection, trigger configuration, component setup, and deployment.
Operators can define triggers across:
- EVM and Cosmos contract events
- Block intervals
- Cron schedules
- Manual execution
WASM components can be assigned with specific permissions — HTTP, file system, raw sockets, DNS — along with execution constraints such as fuel and time limits. Services can be paused, resumed, or removed at any time.
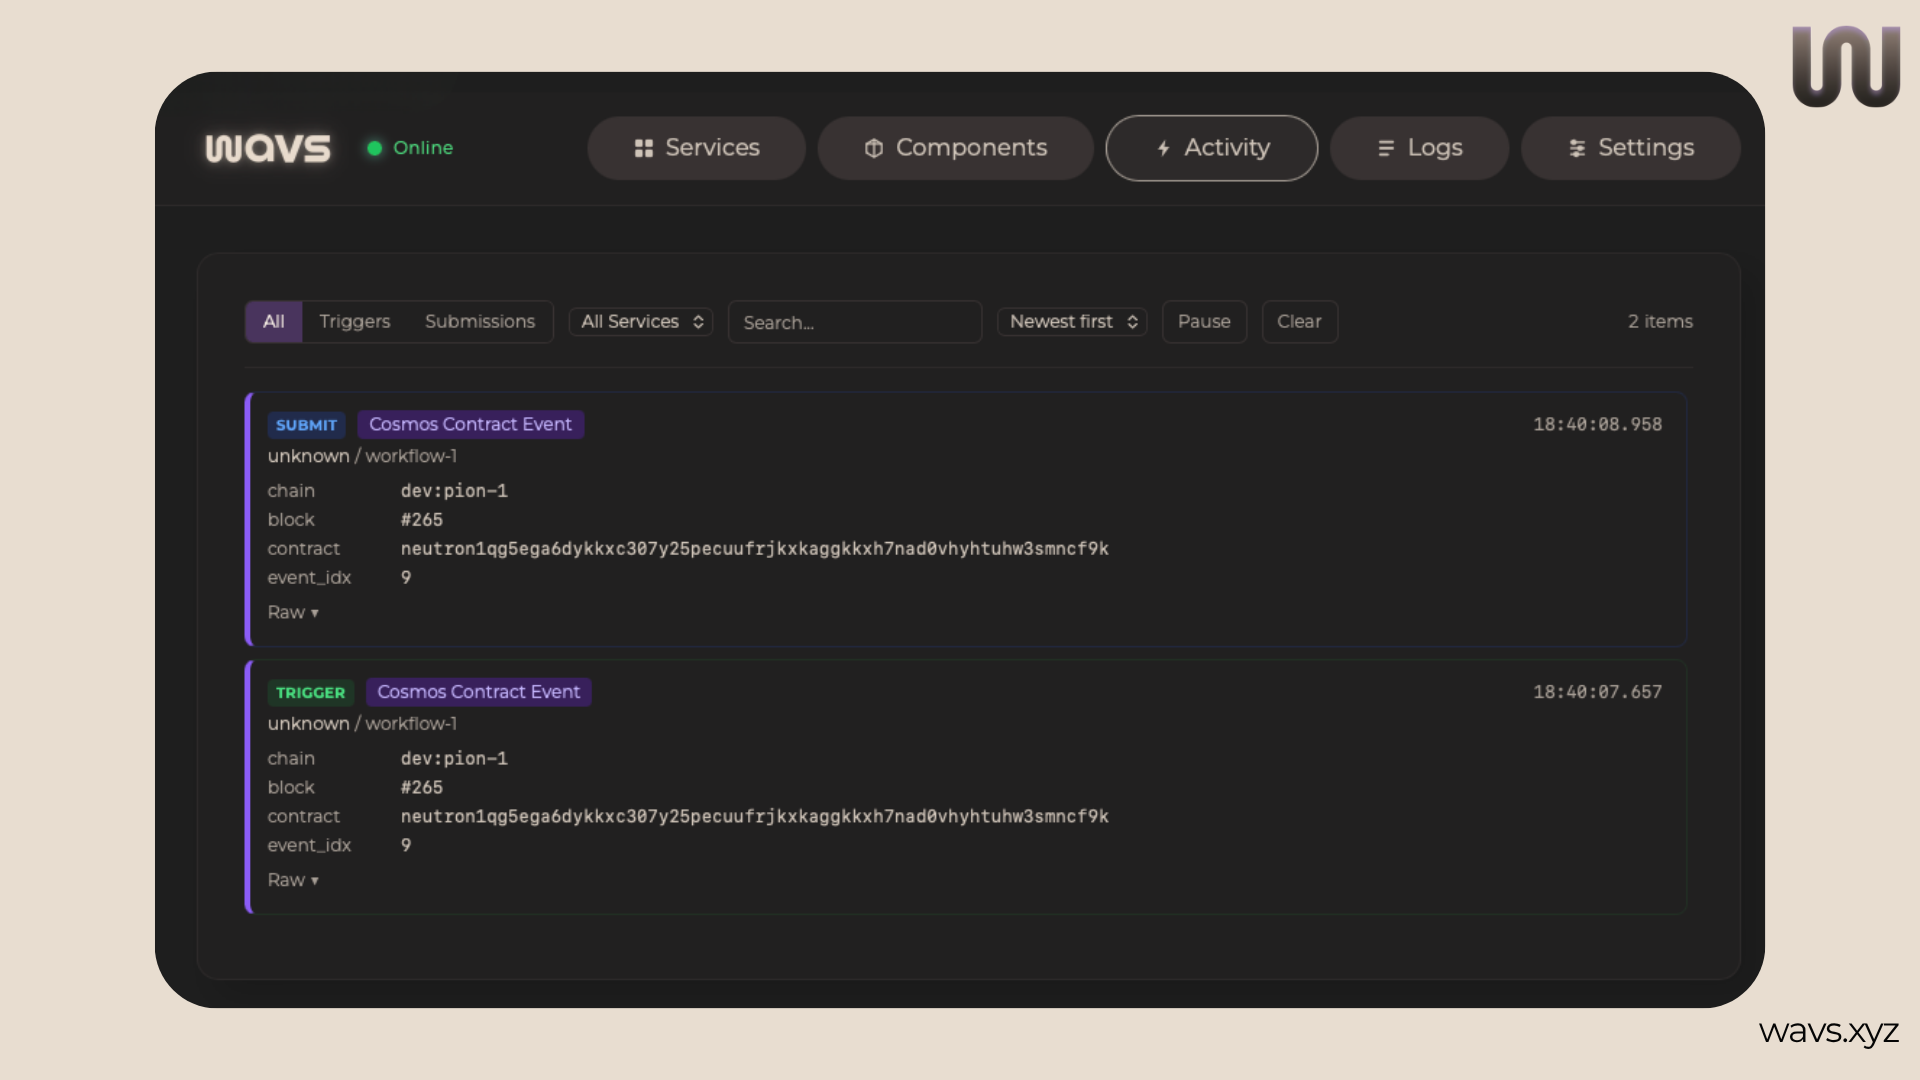
Monitoring
The WAVS Dashboard introduces a consolidated monitoring experience:
- Activity feed — a single view of triggers, operator responses, and submissions as they occur
- Log viewer — supports filtering, search, and high-volume output
- System health — visibility into chain connectivity and node status
This reduces the need to rely on external tooling during development and testing.
Wallet & Network Management
Wallet and network configuration are handled directly within the Dashboard. Operators can:
- Configure mnemonic-based wallets stored securely in the OS keychain
- Track balances across supported networks
- Add custom EVM or Cosmos chains
This simplifies coordination when running multiple services or managing operator infrastructure.
AI Tooling
The WAVS Dashboard includes MCP server support, enabling connections to AI systems like Claude or Codex for assisted component development and service configuration. This makes it easier to observe, configure, and operate WAVS services without relying entirely on CLI-based workflows.